
Educators are the backbone of a strong, well-educated society.
High quality and productive educators improve the economic prospects of future generations. It is critically important that students are provided the best environment for learning.
Teachers’ unions are an institution that can have significant impacts on teacher quality. Today, unions that encompass educators, trainers, and librarians, are on the decline. Only 39 percent of those employed as educators, trainers, and librarians are members of labor organizations across the United States.
Teachers’ Unions Across America
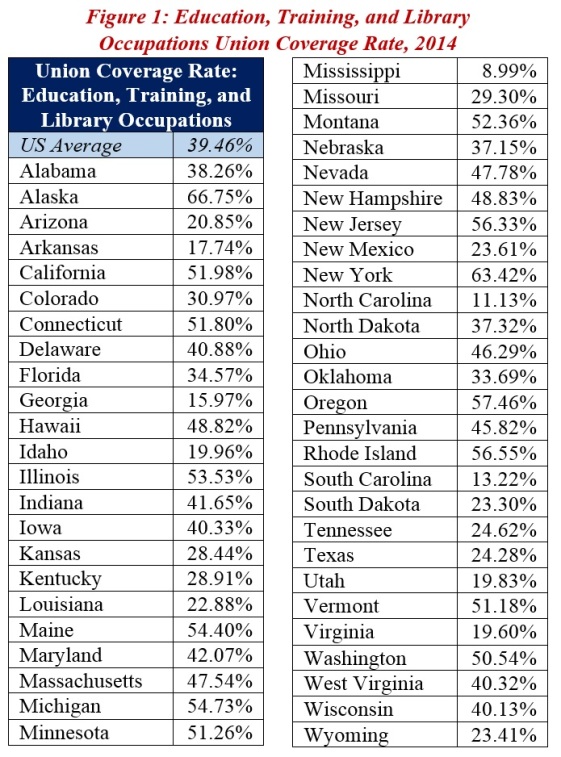
The union coverage rate of educators varies by state. Figure 1 shows the percent of unionized personnel in the education, training, and library occupations across the United States. Alaska has the largest percentage of union employees in education, training, and library occupations, at 67 percent. Other highly unionized states include New York (63 percent), Rhode Island (57 percent), New Jersey (56 percent), Maine (54 percent), and Illinois (54 percent). The unionization of educators, trainers, and librarians remains low in Southern states. Overall, 27 of the 50 states have a teachers’ union coverage rate that is above the national average.
Many studies find that unions increase worker productivity. A “meta-analysis” of economic studies shows that there is a positive association between unions and productivity in the United States. While unions have the largest impact on manufacturing productivity, the researchers find that “unions have a positive and statistically significant positive effect on productivity in U.S. education of 7 percent.” Another paper suggests that public schools with labor organizations are more productive by 3 percent.
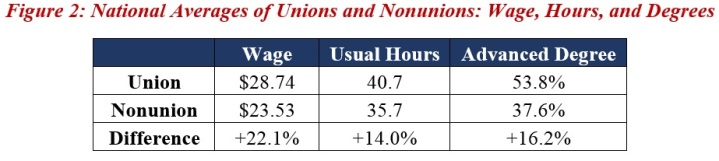
In general, members of unions tend to be more productive due to high-skill training. Over half of union members who are educators, trainers, and librarians have a master’s degree or higher (Figure 2). Compared to their nonunion counterparts, members of teachers’ unions are 16 percentage points more likely to have advanced degrees – which increase the quality and skills of the employee. In addition, union employees earn 22 percent more than non-members in educational occupations. Union teachers also work 14 percent more hours per week than nonunion teachers.
Teachers’ Unions, Class Size, and Student Test Scores
We collected data from National Center for Education Statistics to assess productivity, based on student test scores. We assume that tests scores are a “good” metric to determine the quality of the educator. It is worth acknowledging, however, that test scores may not be the best metric to determine teacher quality.
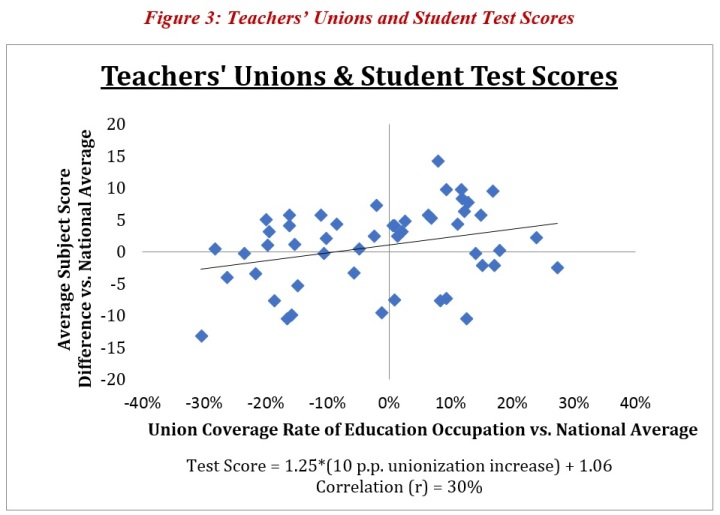
The state-level data shows that average student test scores increase as unionization increases (Figure 3). Four different models were used: fourth grade reading, fourth grade math, eighth grade reading, and eighth grade math. Figure 3 plots the average test score of students (compared to the national average) by the average union coverage rate of educators in all 50 states. There is a moderate, positive correlation between teachers’ unions and better test scores.
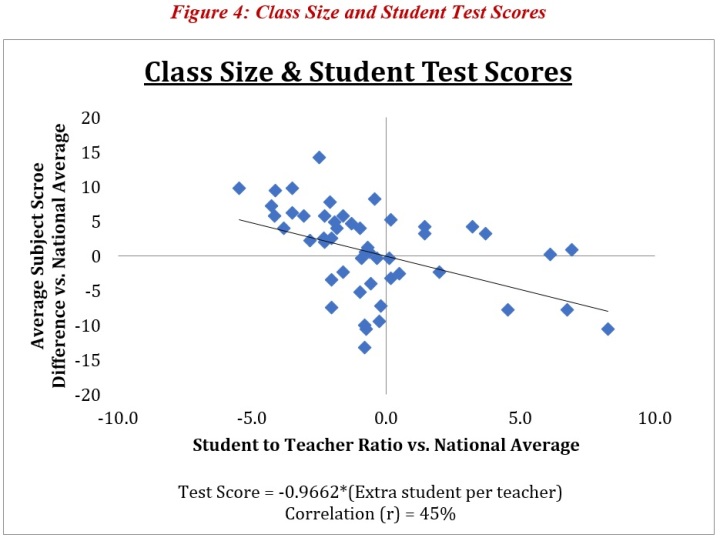
Similarly, smaller class sizes also tend to increase the average students’ test scores (Figure 4). As class size gets larger, the average test scores declines. Having smaller class sizes allows educators to spend more time with students who may have questions or need help. States with smaller class sizes on average have stronger student test scores.
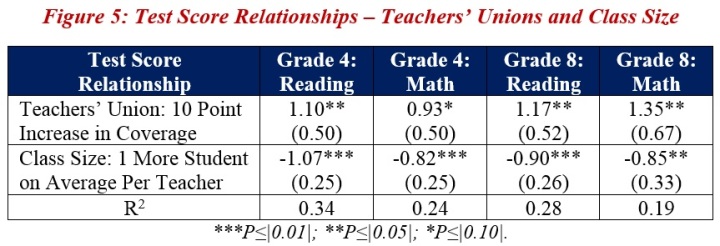
Finally, Figure 5 puts it all together to show the correlation of teachers’ unions and average class size on student test scores. Based on scores in nationally standardized tests (fourth grade reading and math and eighth grade reading and math), greater union membership of educators tends to have a positive impact on student test scores while larger class sizes tend to have a negative effect.
In the statistical analyses, teachers’ unions had a positive impact on fourth grade reading, eighth grade math, and eighth grade reading – but did not show a statistical correlation in fourth grade math. In general, a 10 percentage-point increase in teachers’ union coverage in a state tends to increase test scores by 1.1 to 1.4 points compared to the national average. Meanwhile, class size has significant impacts in all four models: An increase of one student per teacher is statistically associated with a 0.8 to 1.1 point drop in student test scores compared to the national average. Conversely, smaller class sizes improve student test scores.
Final Thoughts
“The contention that unions play a role in misallocating resources, sending them away from where they are most needed, is a distraction from efforts to address the persistent nature of achievement gaps between advantaged and disadvantaged students.” –Emma García and Lawrence Mishel (2016)
Taxpayers get what they pay for.
Sure, unionized teachers earn 22 percent more on average than nonunion teachers.
But they also work 14 percent more hours per week and are better educated. Union teachers are 16 percentage-points more likely to have a master’s or other advanced degree than nonunion teachers.
In addition, a 10 percentage-point increase in the share of teachers that are covered by labor organizations is generally associated with a 1.1-1.4 point increase in student test scores. Teachers’ unions also often fight for smaller class sizes. To the extent that they are successful at reducing class size, teachers unions have another positive impact on student outcomes: For every one-student decrease in class size, test scores tend to improve by 0.8-1.1 points.
Ultimately, the decline of teachers’ unionization across the United States may have negative consequences on student outcomes and long-term economic growth.
