
Subsidies play a prominent role in economic development policy at both the state and local levels in Illinois, yet subsidy policies continue to lack the strict scrutiny they deserve.
This post is the second in a four-part series on the costs of business subsidy programs by the Illinois Economic Policy Institute (ILEPI).
Full Report: Playing Favorites: Understanding the Demographics of Economic Development Subsidies in Illinois
Illinois residents are already grappling with increased taxes following the protracted two-year budget impasse, and it’s as important as ever to guarantee their hard-earned money is helping those who need it most. The second report in the Economic Development Subsidy Series by ILEPI evaluates subsidies in the context of their geographic distribution and demographics. It poses the question of whether they help the people and communities who are most in need of economic aid.
Distribution of State Subsidies in Illinois
Since 1985, businesses in 242 municipalities received subsidy support from the state. Overall, the allocation of subsidies is not evenly distributed throughout the state by population, favoring municipalities that are majority white and those with poverty rates below the state’s average.
- Hoffman Estates received the highest value, totaling over $520 million, which is 26 percent of total state subsidies distributed in Illinois; conversely, Hoffman Estates only has 0.4 percent of Illinois’ population.
- With the exception of Chicago and Joliet, subsidies per capita for each of the top 10 municipalities exceed $1,000, with Marissa having the highest in the state at $13,451; the average subsidy per capita for all municipalities is $695.
- Of the 242 municipalities that received state subsidies, 77 percent had a smaller share of minority population than the state in 2010.
Top 10 State Subsidy Locations by Municipality (1985-2016) and Select Demographics
Distribution of State Subsidies in the Chicago Region
While state subsidies are relatively prevalent across the entire Chicago region – which in this report includes Cook, DuPage, Kane, Kendall, Lake, McHenry, and Will Counties – particular localities benefit more.
- The southern portions of Chicago and Cook County have noticeably higher poverty and unemployment rates, yet only 80 subsidies were issued to locations there, while just over 130 and 120 subsidies were issued to locations in DuPage and Lake Counties, respectively.
- With the exception of Chicago, the ten municipalities that received the highest value of subsidies – which account for 91 percent of all subsidies in the region – all have higher median incomes and lower poverty rates than the state average.
Top 10 State Subsidy Locations in the Chicago Region by Municipality (1985-2016) and Select Demographic Measures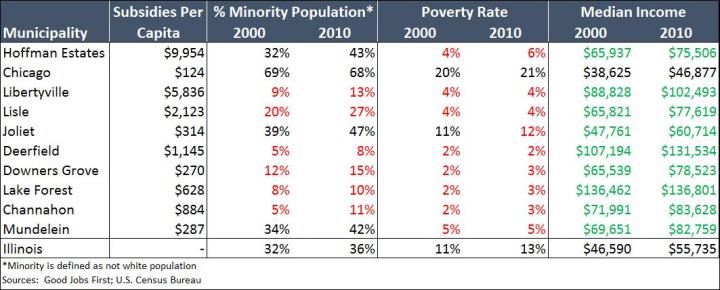
Distribution of Local Subsidies in Chicago
In addition to receiving state subsidies, the City of Chicago has a long history of offering local subsidies in the form of Tax Increment Financing and Small Business Improvement Funds.
- The north side of Chicago has received over 1,600 local subsidies, while the south side has received fewer than 500.
- Although a large number of the local subsidies do focus on areas with higher poverty and unemployment rates, there is still a concentration of larger deals in the more affluent downtown area and a significant shortage on the south side of Chicago.
Local Subsidy Locations (1985-2016) and Unemployment Rates by Census Tract, Chicago

Illinois and the City of Chicago have spent over $2.1 billion and $2.4 billion, respectively, since 1985 on subsidies to private corporations. Yet inequality continues to rise and workers continue to grapple with under- and unemployment. Before another company convinces Illinois to shell out millions, or even billions, of dollars in subsidies in the name of job creation – much like Foxconn has recently done with their $3 billion deal in Wisconsin – the state must carefully consider whether this money can be used in a better way.
